OUR IMPACT
OUR IMPACT
Our vision for success is to
win together.
Ventas creates long-term, sustainable value for our shareholders by enabling exceptional environments that benefit the aging population. Across our portfolio, our work helps people live longer, healthier, happier lives.
OUR CORPORATE SUSTAINABILITY STRATEGY

OUR IMPACT
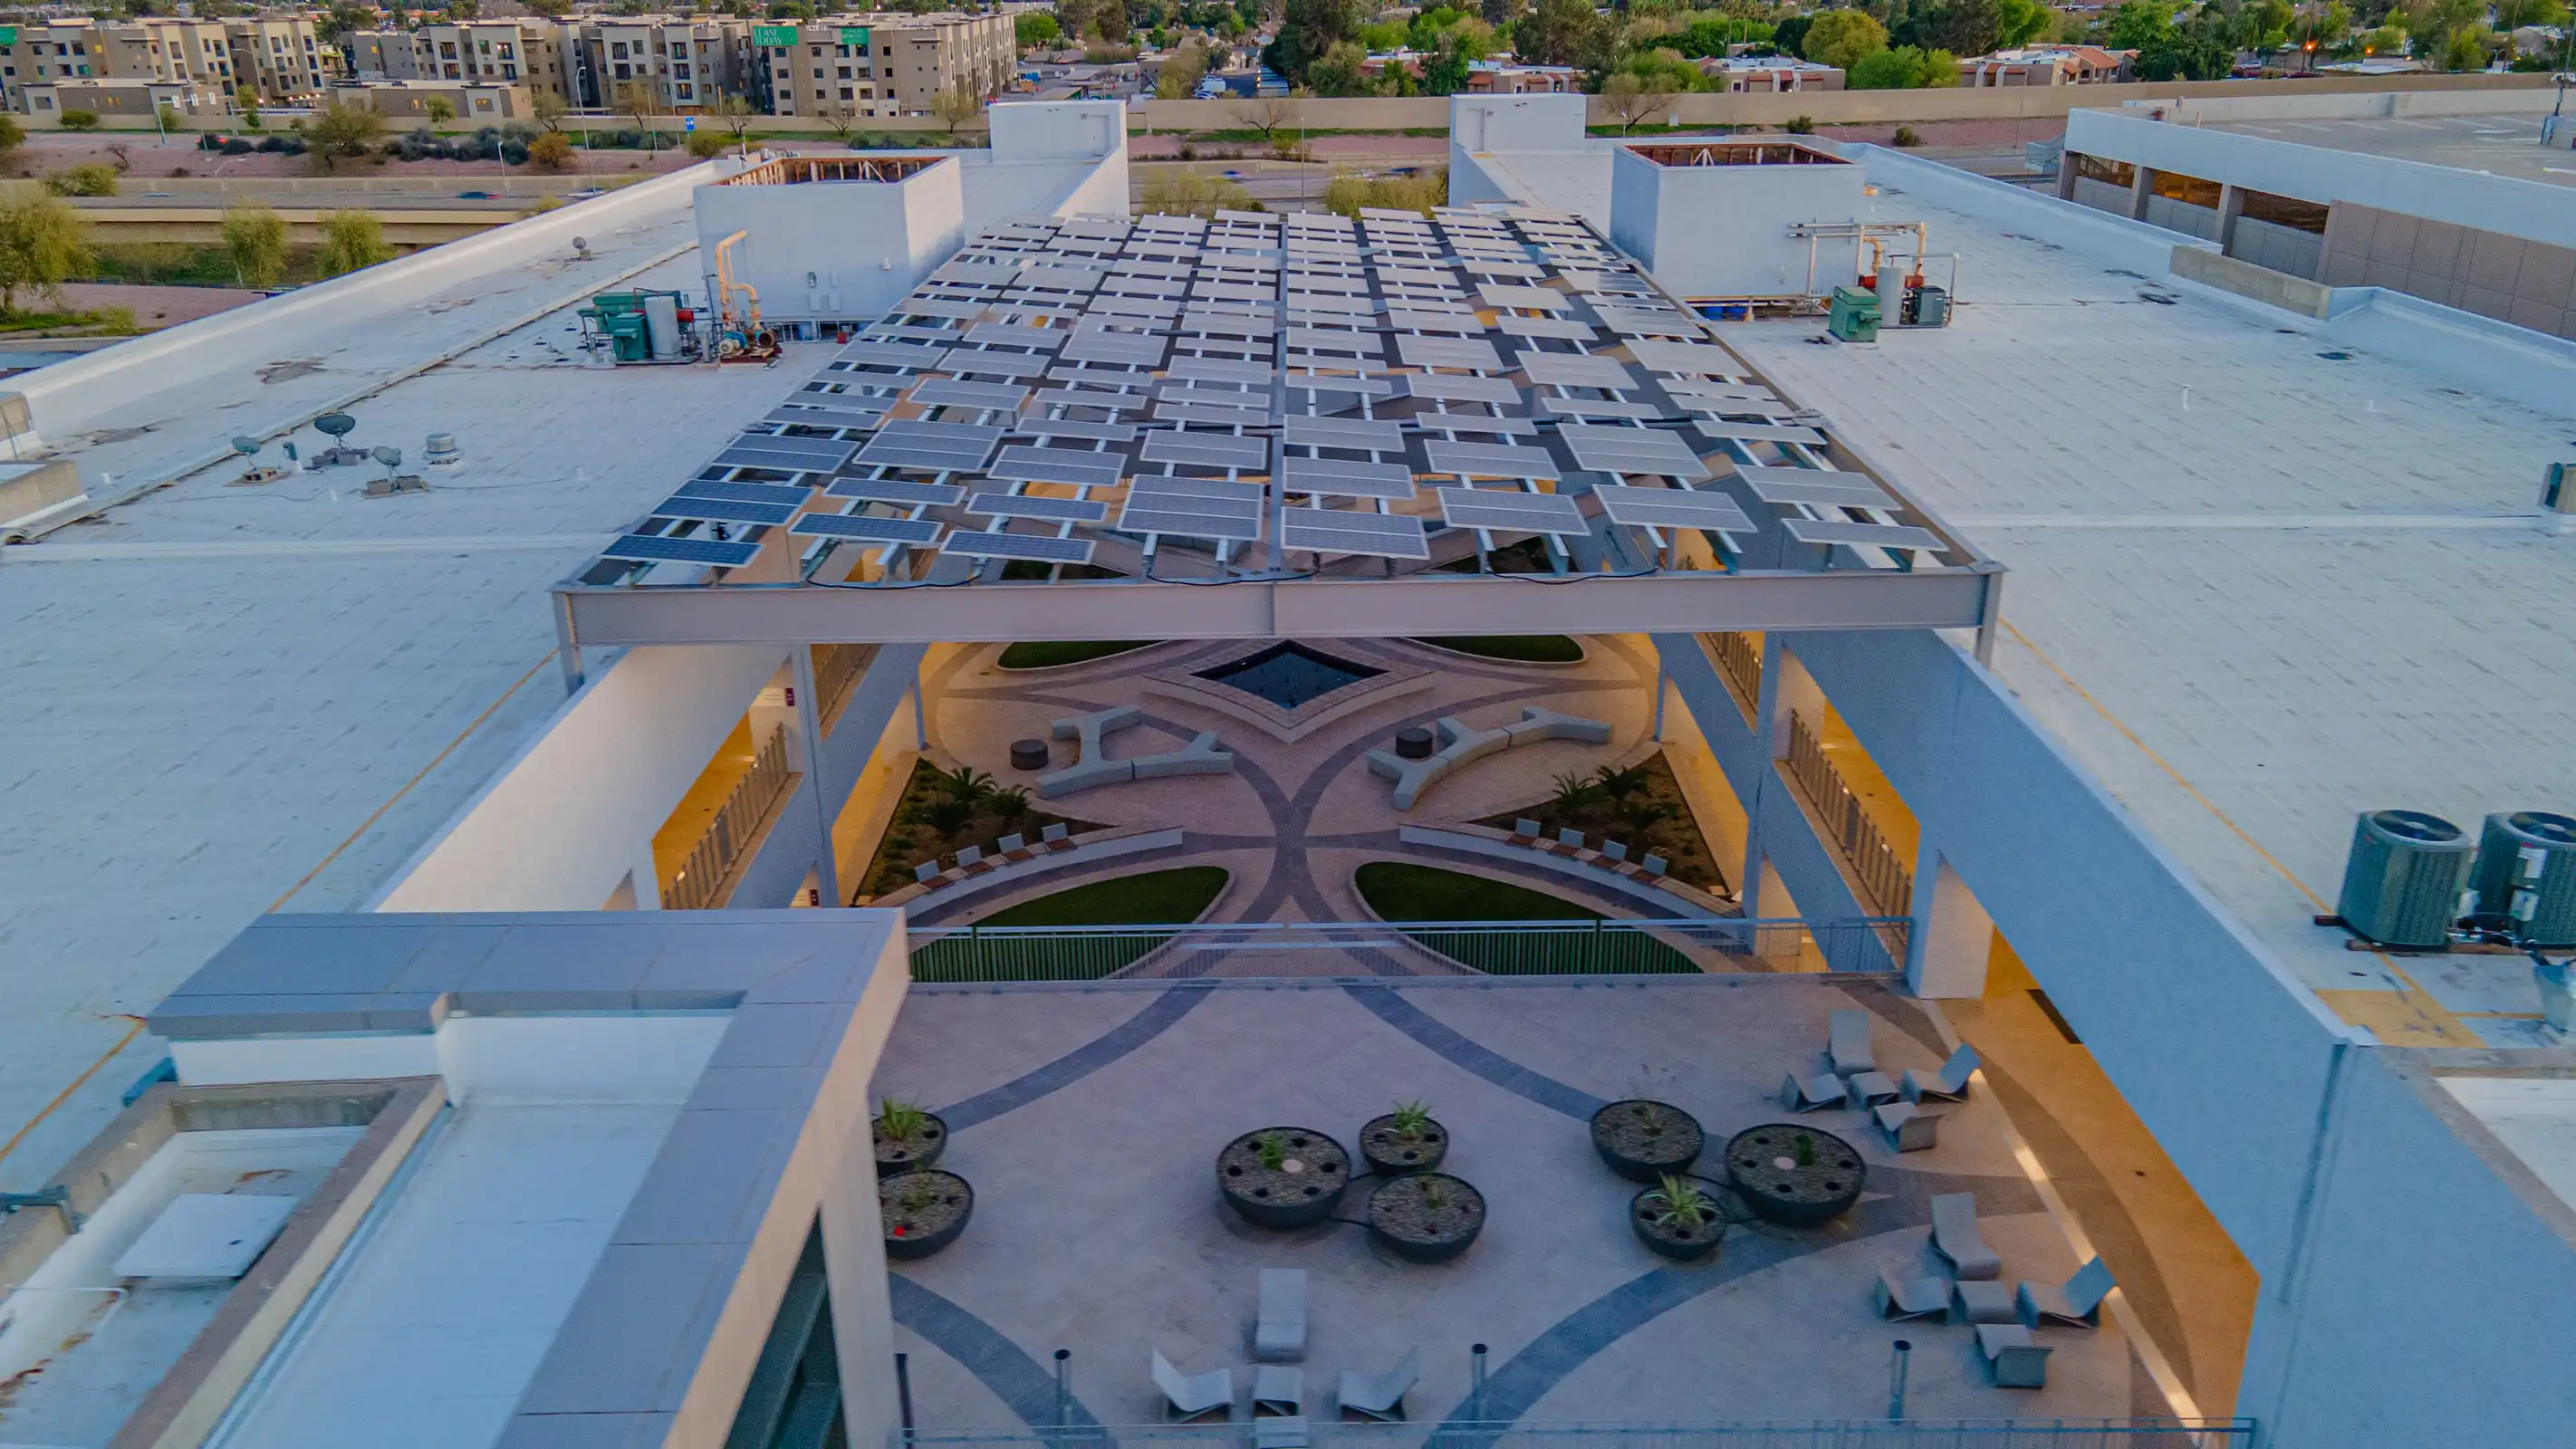
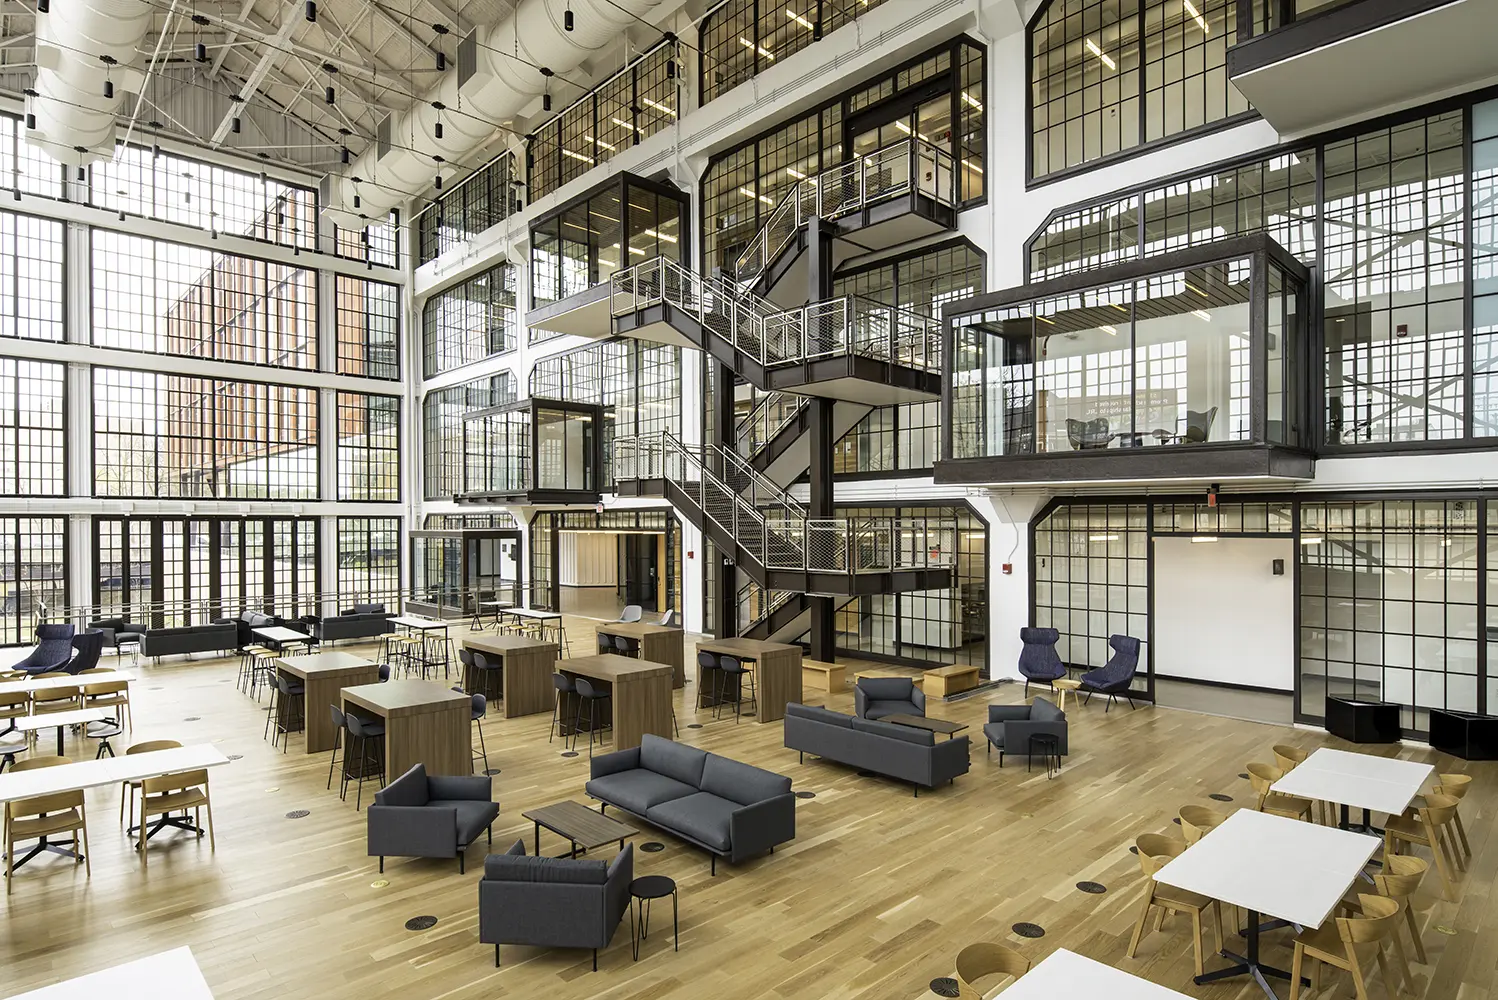
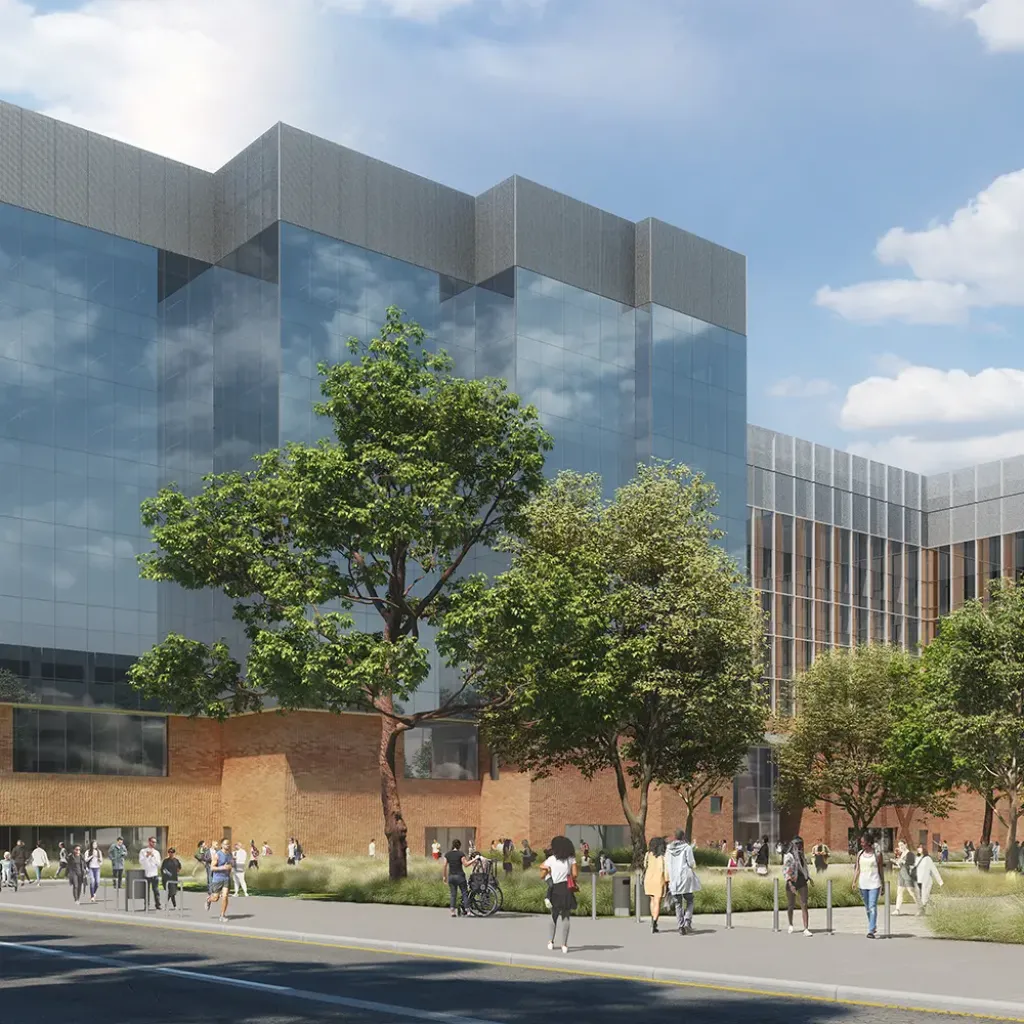
Enabling sustainable environments
and strong communities

OUR PEOPLE
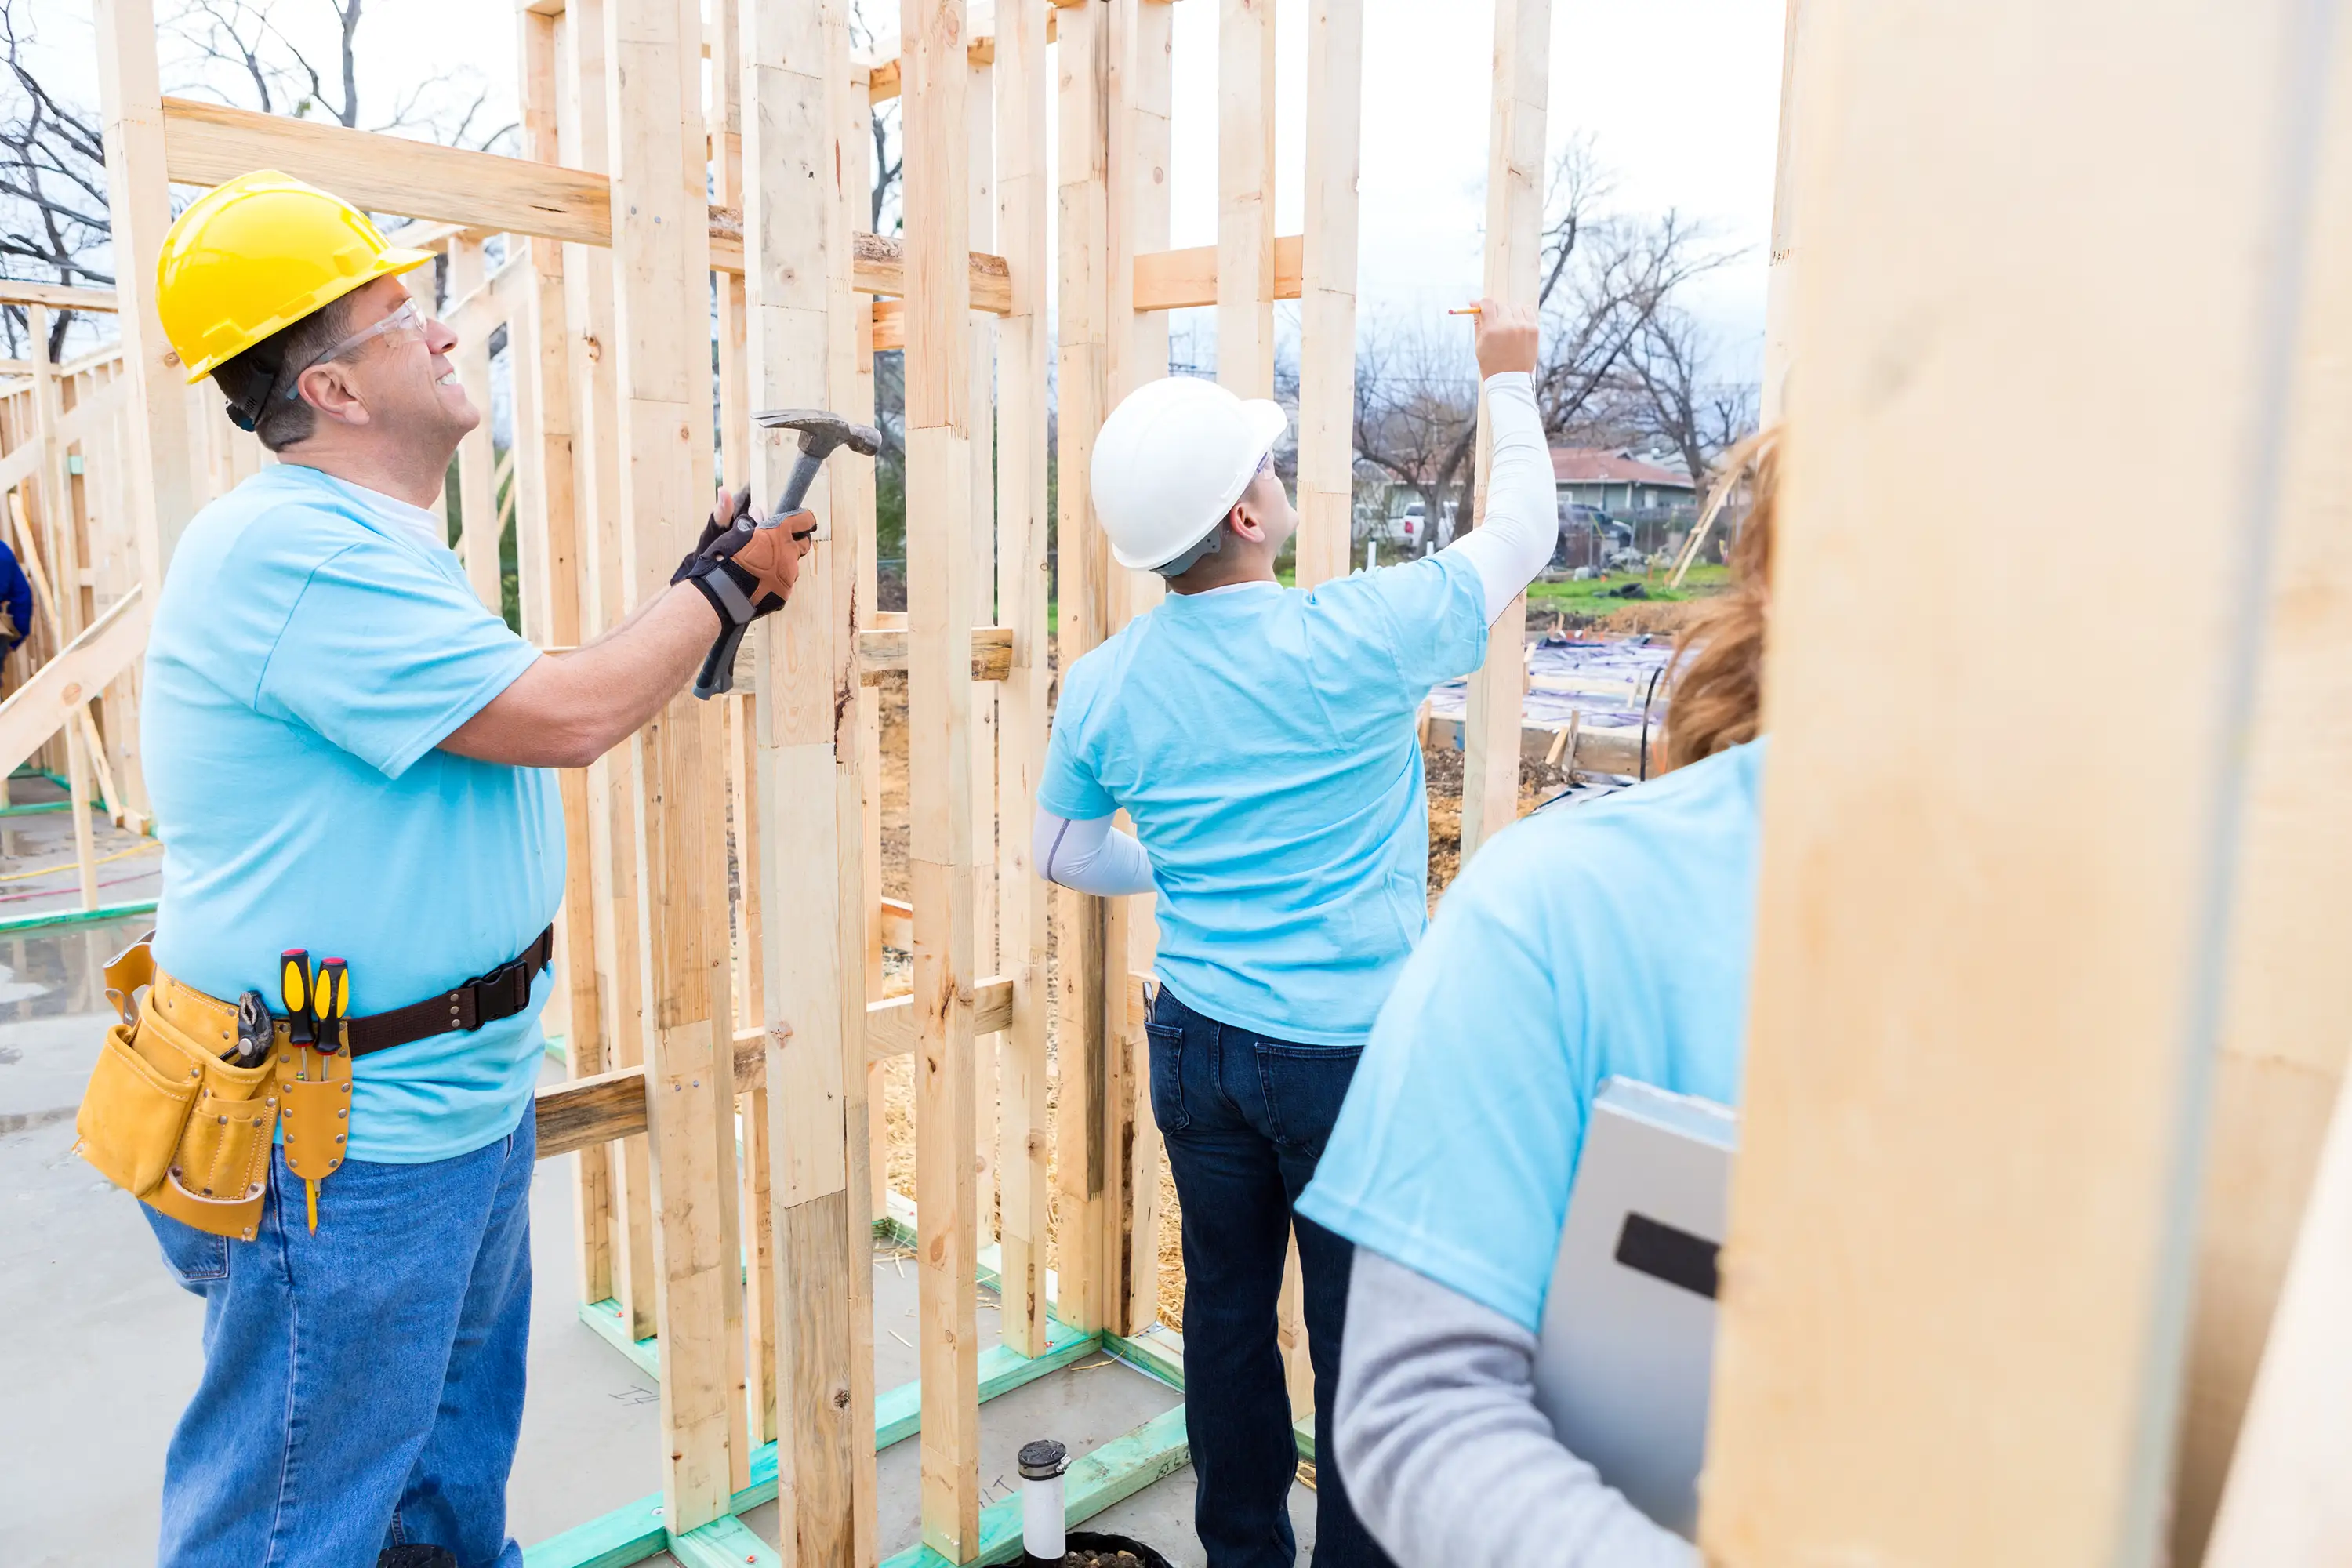
Engaging exceptional people

OUR STANDARDS
Leading in governance and transparency
OUR IMPACT
We enable world-class environments for care and scientific advancement and foster vibrant communities. Our multifaceted strategy encompasses quality, investment, safety and resiliency—positioning Ventas to achieve long-term success for our shareholders.
30M+
green building certified square feet
~800
property-specific decarbonization roadmaps
97th
percentile in tenant satisfaction in outpatient medical portfolio
OUR PEOPLE
We excel at what we do by investing in the best talent across disciplines and industries. We encourage collaboration, recognize individuals for their unique strengths, and continually enhance our employee resources.
40%
of employees have been promoted from within
6,100+
hours of employee training and programing
98%
of eligible leaders participated in leadership development program
OUR STANDARDS
We have a strong commitment to corporate governance. Ethics, integrity and transparency serve as the foundation for long-term, sustainable value creation.
7
new directors appointed to the Ventas Board of Directors since beginning of 2019
92%
of directors are independent
70%
of outstanding shares included in Board-led shareholder outreach
100%
employee compliance on annual key policy acknowledgements
CORPORATE SUSTAINABILITY
See our latest Corporate Sustainability Report.
 Download Report